AP04 batch inspection by drone: making every inspection consistent
Why two samplers on the same batch arrive at different results, and how a digitally computed sampling grid and volume take that variation out.

Send two samplers to the same batch and you get two reports. Usually they sit close together, sometimes they do not. That is not a question of craftsmanship: it is a property of a process that asks for a judgement in several places.
This article is about where that variation comes from, and what changes when the measuring, the sampling grid and the volume calculation are done digitally instead of by hand.
Where variation in a batch inspection comes from
The AP04 protocol prescribes precisely how a batch must be inspected: how many increments, spread across which grid, with what distribution over the batch. What the protocol does not do for you is measure the batch. And that is where it starts.
To work out the grid you need the dimensions of the batch: length, width, height and the shape of the foot. In practice those get established with a tape measure, a GPS rover or by eye. On a tidy rectangular batch on a flat slab that works fine. On an elongated heap against a retaining wall, with a worn flank and a sloping foot, it becomes a judgement.
And those dimensions are the basis for everything that follows. A grid set out on the wrong dimensions is the wrong grid, even if the formula behind it is flawless. A volume computed from the wrong dimensions is the wrong volume. So the inaccuracy does not sit in the protocol; it sits in the measurement the protocol is applied to.
One colleague is better at the measuring than another. They want to do it properly, but they struggle with it.
The consequence is familiar to every consultancy: volumes that get challenged afterwards, explanatory notes that have to be written, and now and then a fresh application notification. That last one does not just cost you time, it holds up the work at your client.
How a drone survey changes the inspection
A drone solves this by not measuring the batch but capturing it. The drone flies a set pattern over the batch and takes hundreds of overlapping photos. Software recognises the same points across multiple photos and computes from them the shape of the batch in three dimensions: a point cloud of millions of 3D points.
That leaves you with the actual geometry of the batch rather than estimated dimensions. Including the worn flank, the sloping foot and the bulge in the middle. Everything that follows is then computed on that geometry instead of on a judgement.
The grid is no longer set out, it is computed
This is the biggest change, and the one that needs the most explaining. In the traditional method you physically set out the grid points on the batch: measure, mark, then drill at the marks.
With a 3D model it works the other way round. The grid is laid over the captured batch digitally, following the BRL 1000 system, and the sampler receives a digital map of the drill locations. Nothing is set out physically any more: the drilling happens at positions that have already been computed.
- The drone captures the full geometry of the batch
- The software computes the grid to the BRL 1000 guidelines, including topographic position
- The sampler receives a digital map with the drill locations
- In the field the drilling happens at the indicated positions
The effect: the grid no longer depends on who is standing there with the tape measure that day. The same batch produces the same grid, whoever carries out the survey.
What you get out of it
In practice a batch inspection comes down to a handful of fixed pieces, and all three can be computed from the 3D model:
- The sampling grid to BRL 1000, with topographic position and photo points
- The volume of the batch, computed from millions of measurement points rather than from a formula on estimated dimensions
- The cross-section with the increments marked, ready to drop into the report
There is more to say about the volume. Because the actual shape of the batch has been captured, the calculation lands consistently within about 2% of the real volume. That is not only more accurate, it is above all traceable: the calculation goes back to a dated survey rather than to an assumption.
How accurate is such a survey exactly? How photogrammetry worksTraditional versus digital measuring
| Traditional | Digital measuring | |
|---|---|---|
| Measuring the batch | 1 to 1.5 hours | 15 to 20 minutes |
| Sampling grid | Set out by hand | Computed from the 3D model |
| Volume | Formula on estimated dimensions | Computed from the actual shape |
| Report preparation | Assembled by hand | Standardised |
| Consistency between staff | Variable | Identical |
| Rework on a volume dispute | Regular | Virtually none |
Where the time saving is, and where it is not
It is only fair to add some nuance here, because the saving on site is often overstated. If you have tidy, well-laid-out stockpiles on level ground, a drone survey might save you half an hour per batch. That adds up over a year, but it is not the reason to switch.
The gain sits mainly in the office and after. Where working up the grid and volume traditionally takes some 90 minutes, digitally it is ready within 15 to 20. On top of that, most of the rework disappears: no notes written to defend a volume, no fresh application notifications caused by a questionable grid.
And there is a third effect that is harder to quantify but that consultancies often name as the most important: the report is your calling card. A standardised document with a computed grid and a traceable volume reads differently from a filled-in form, and clients notice.
What it does not change
A drone measures the batch; it does not inspect it. The drilling, composing the sample and the laboratory work stay exactly as they were, and that is the intention: that is the sampler's trade and where the substantive judgement sits.
Nor does it change your certification. The BRL 1000 accreditation stays with the consultancy and responsibility for the inspection stays with the sampler. What changes is how the batch is measured and how the report is produced, not who stands behind it.
And there is a practical limit: the camera has to be able to see the batch. Material under a canopy or in a shed cannot be measured from the air.
What to watch for if you are considering this
Whether this works in your consultancy depends less on the technology than on how it fits your existing process. Five questions make the difference:
- Is the output BRL 1000 compliant, or do you still have to compute something yourself before it can go in the report?
- Does it fit your existing reporting format, or does it produce a loose file you end up retyping?
- Who is allowed to fly? Above 250 grams licence requirements come into play, and that decides whether your existing samplers can do it themselves
- How much training does it take? If it becomes a specialism it depends on one person, which makes it fragile
- Are part batches, asbestos-suspect and in-situ batches supported, or only the straightforward case?
Those last two are the most underrated in practice. A solution that only handles the tidy rectangular batch fails to solve precisely the cases where the variation was.
How we do it
AP04 Map is our answer to this: a workflow that automates the measuring, the sampling grid and the volume calculation and turns them into a standardised report. Supported for BRL 1001 and 1002, part batches, asbestos-suspect batches and in-situ batches, so the awkward cases fit too.
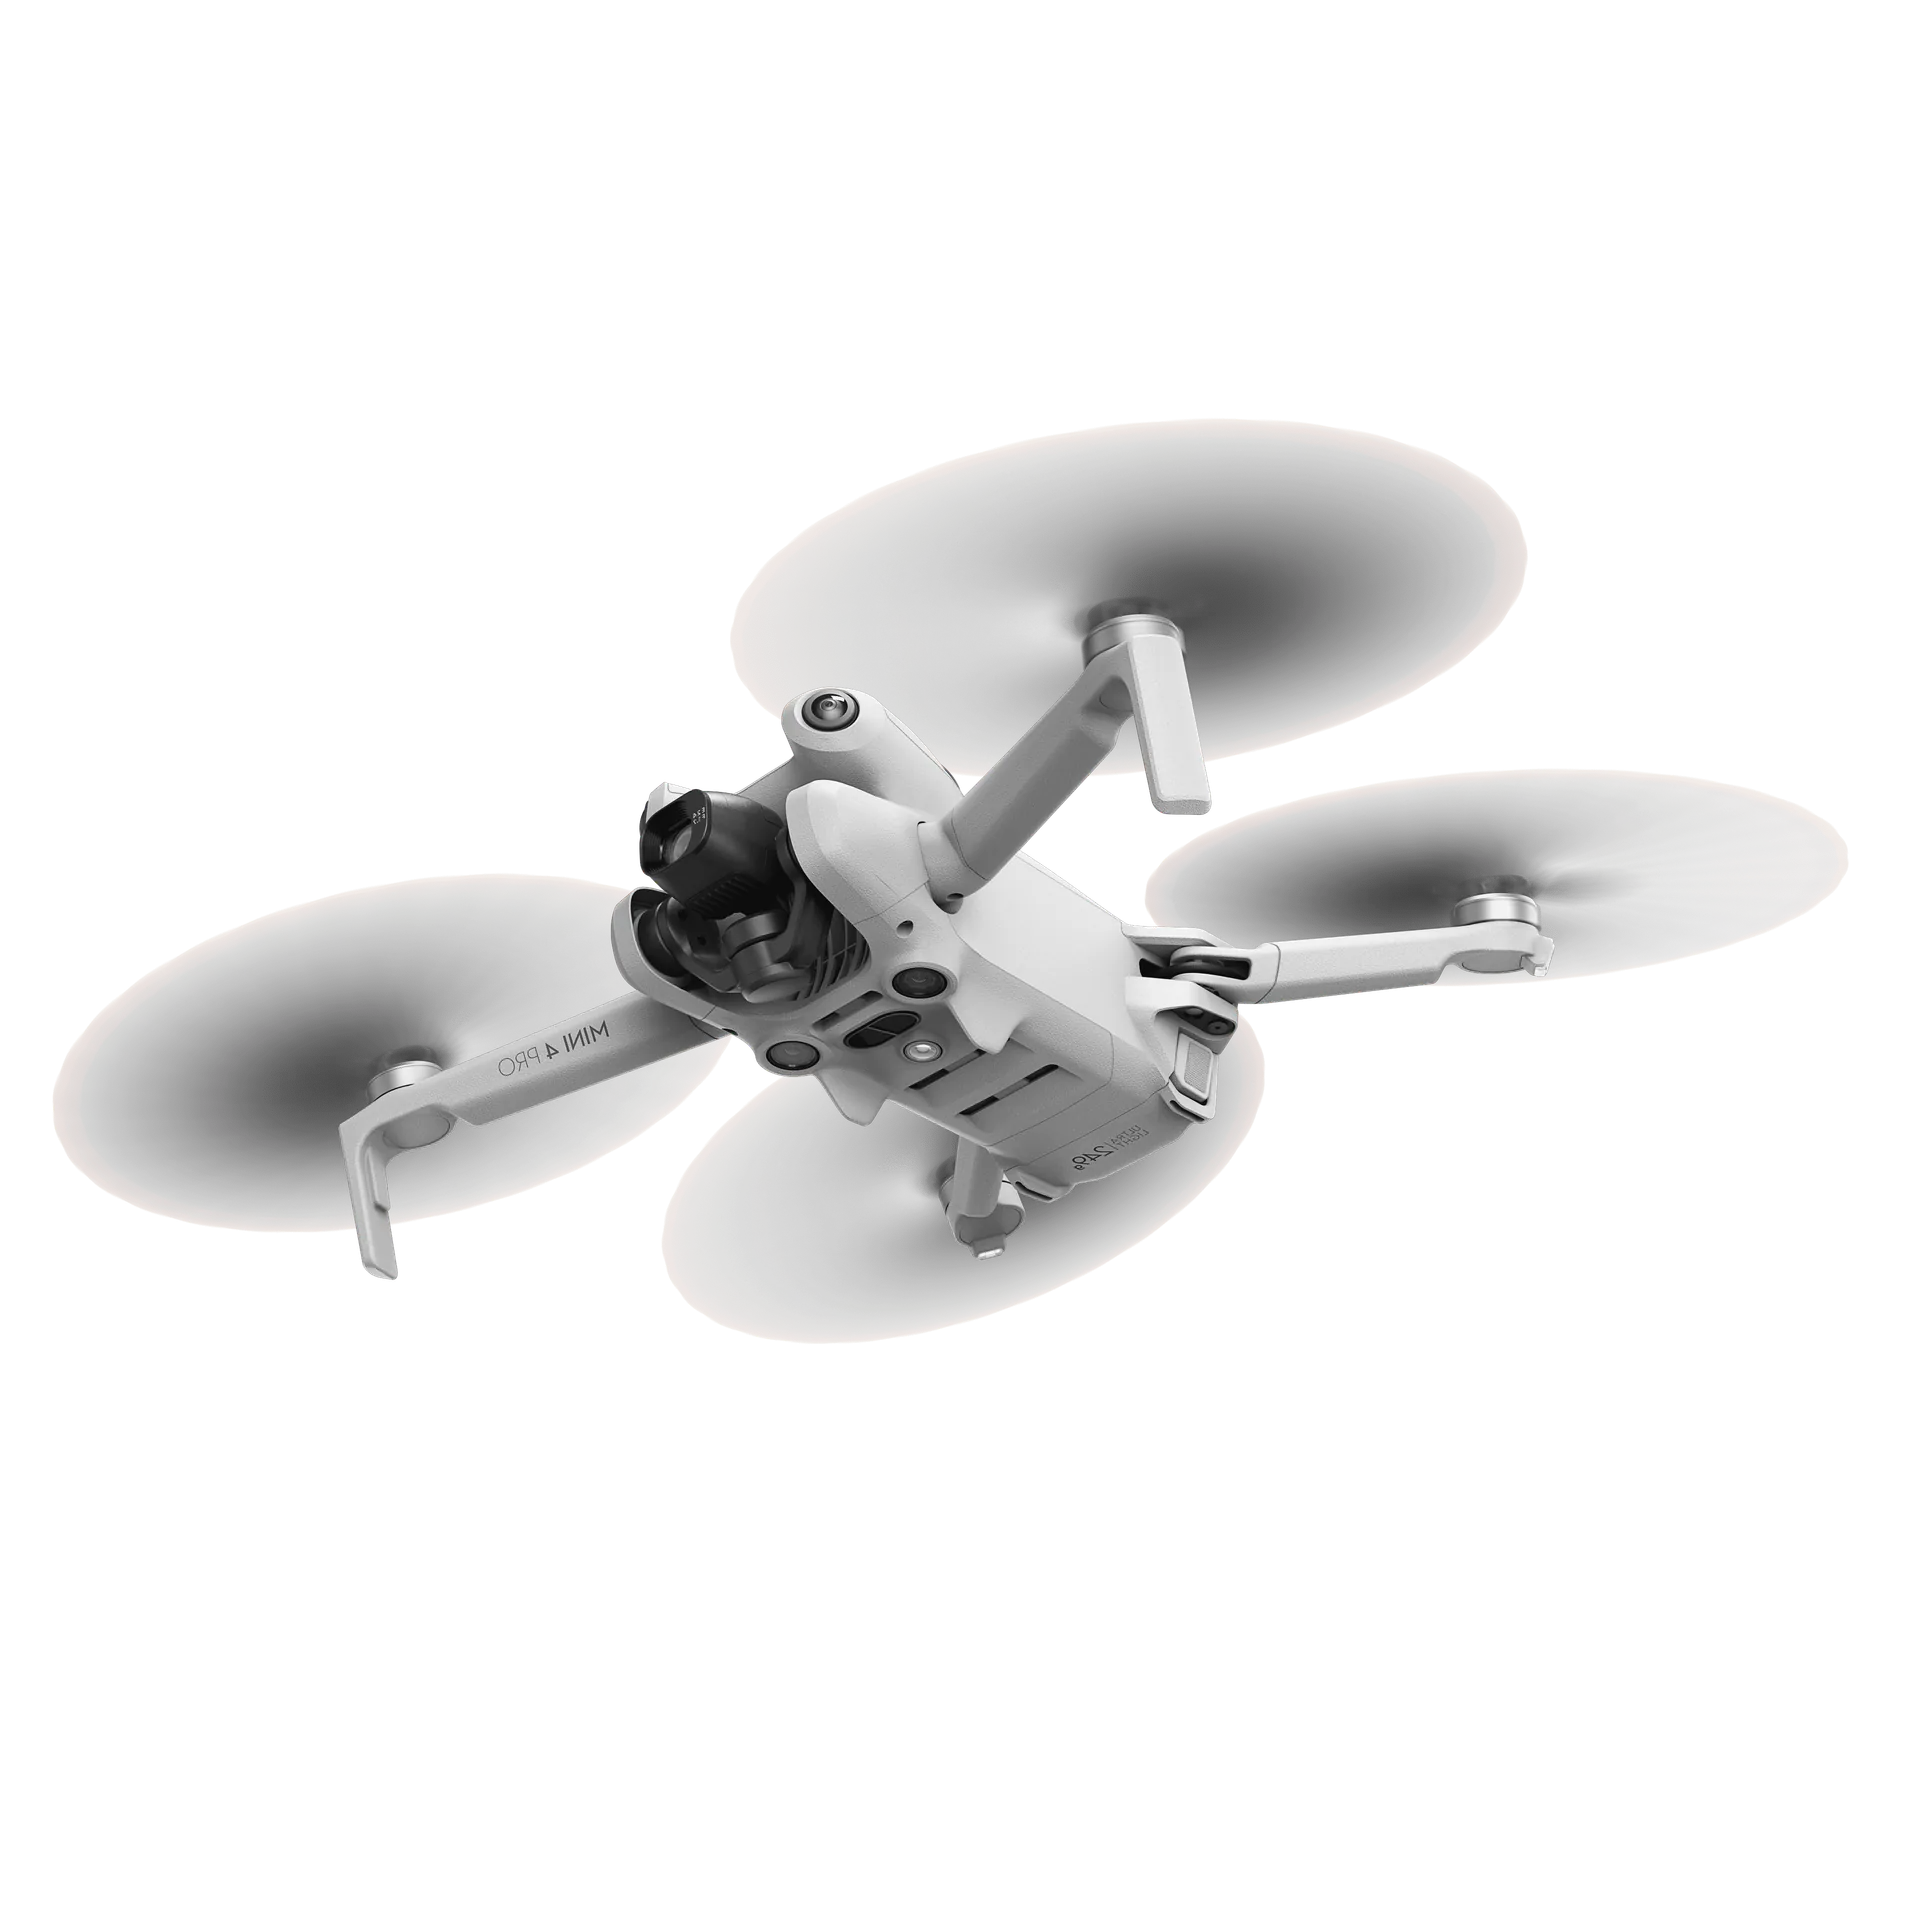
The drone weighs less than 250 grams, so no drone licence is needed and your existing samplers carry out the survey themselves. It is one package with drone, platform, on-site training and ongoing support; in practice samplers are operational within a morning, with no prior knowledge or drone experience. Subscriptions are matched to your survey frequency and cancellable monthly.
An example of how that plays out: MAH Milieu, a BRL 1000 certified consultancy, brought measuring on site down from roughly an hour and a half to about twenty minutes. The grid and the volume are then ready digitally, after which the sampler starts drilling at the computed locations. Their own summary: hard figures instead of an estimate by feel, and every sampler produces the same report.
See how AP04 Map works