How does drone 3D mapping work? Photogrammetry and accuracy explained
From overlapping photos to a measurable 3D model. What photogrammetry is, why there are two kinds of accuracy, and what to expect without RTK, with RTK and with ground control points.
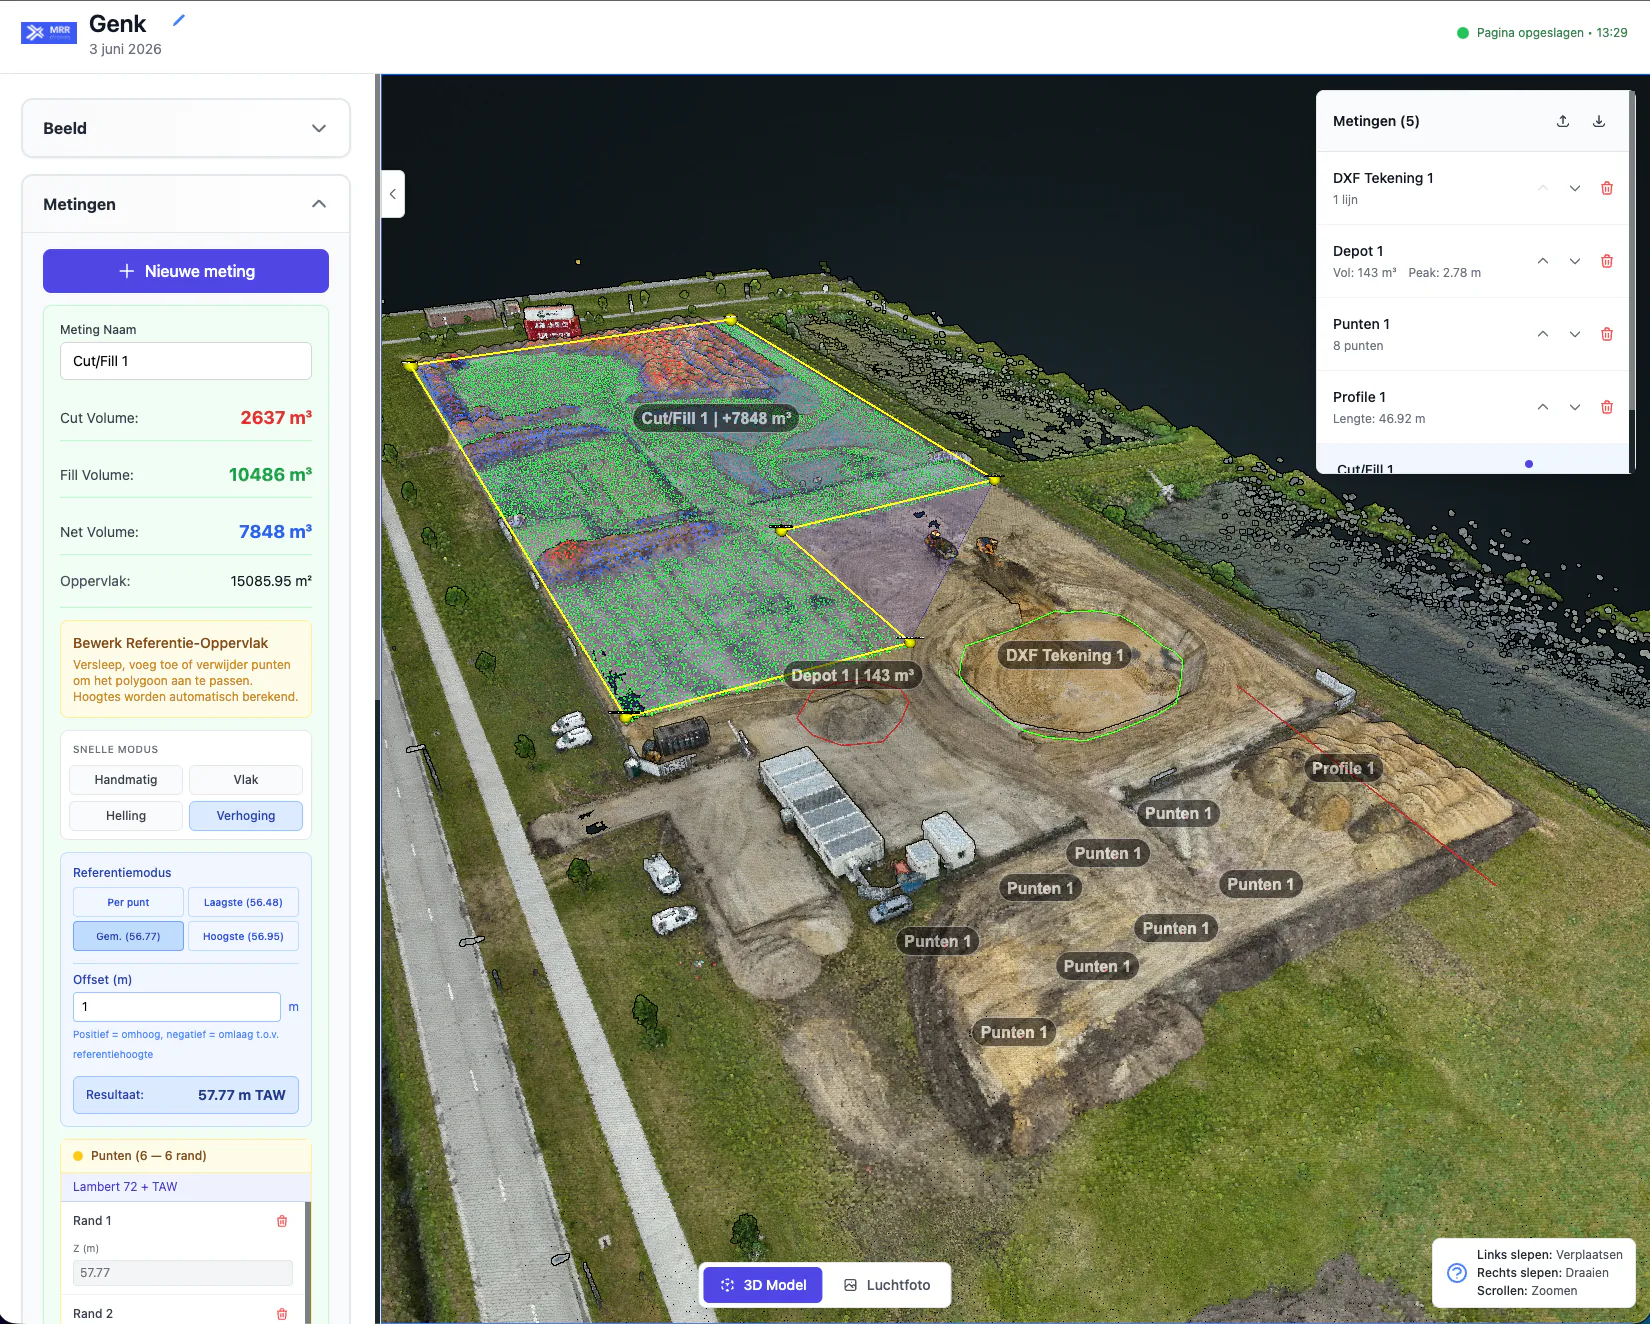
A drone takes photos, and half an hour later you have a 3D model you can measure in. To anyone seeing it for the first time it feels a little like a conjuring trick. It is not: the technique behind it is almost a century old, and the method is perfectly understandable without a mathematical background.
This article explains how it works and, more importantly, what accuracy you can expect. Because there is no single answer to "how accurate is a drone?", and that is exactly what muddies most conversations about it.
Photogrammetry in plain language
Start with your own eyes. You see depth because you have two eyes viewing the scene from slightly different positions. Your brain compares those two images, sees how far each object shifts between them, and works out how far away it is. Close up the shift is large, far away it is small.
Photogrammetry does the same thing, but with hundreds of images instead of two. The drone flies a grid over the site and takes photos along the way with generous overlap, usually around 70 to 80% in both directions. Every point on the ground therefore appears in dozens of photos, each time from a different angle.
The software then searches all those photos for recognisable points: a stone, a crack in the tarmac, a grain pattern in the sand. Such a point is found again in dozens of photos, and from the shifts between all those images it can compute where that point must sit in space. At the same time it computes where the camera was at the moment of each exposure.
This happens for millions of points at once, in one large joint calculation in which all the photos and all the points correct one another. What comes out is a point cloud: millions of 3D points that together describe the shape of the site. From that a continuous surface is built, and the photos are draped over it into a geometrically corrected aerial image, an orthophoto.
Why that beats individual points
A surveyor with a GPS rover measures dozens of points and interpolates between them. Photogrammetry measures the entire surface. On an irregular pile of sand the difference sits precisely in what happens between the individual points: the bulges, the worn flanks and the hollows that interpolation misses.
Why overlap and flight height decide everything
Two settings determine almost the entire quality of a survey: how high you fly and how much the photos overlap.
Flight height determines the GSD, the ground sample distance. That is simply how many centimetres of ground one pixel in the photo covers. Fly lower and the GSD gets smaller and you see more detail, but you need more photos and the flight takes longer. As a rough rule, your accuracy never gets much better than a few times the GSD: you cannot measure what the camera could not resolve.
In practice we fly between 40 and 80 metres. At 40 metres that works out at a GSD of around 1 centimetre per pixel. Flying higher is quicker and covers more ground per flight, but gives you a coarser GSD. For volumes, levels and cut and fill that margin is more than enough.
Overlap is the second factor, and the most underrated. Every point has to appear in enough photos to be computed reliably. Too little overlap produces holes in the model, or worse: a model that looks complete but is locally distorted. Flat, uniform surfaces such as loose sand or a fresh layer of tarmac need plenty of overlap, because there are few recognisable points to match on.
Two kinds of accuracy, and this is the heart of it
If one thing sticks from this article, let it be this. A 3D model has two very different kinds of accuracy, and they get confused constantly.
Relative accuracy is about the proportions inside the model. Are the distances and height differences between points correct with respect to each other? That is what you need for volumes, height differences, profiles and comparing two survey dates.
Absolute accuracy is about whether the model sits in the right place on Earth. Are the coordinates and the levels where they belong in the national grid and height datum? That is what you need for setting out, for machine control, and for a handover with a level reference.
And now the consequence that often surprises people: a volume survey can be excellent while the model as a whole sits metres away from reality. If the entire point cloud is three metres too high, the foot of the pile is three metres too high as well, and the volume in between stays exactly the same. Volume is a proportion, not a position.
That is why "how accurate is a drone survey?" is an incomplete question. The right answer starts with: what are you going to use it for?
Without RTK, with RTK, and with ground control points
Absolute accuracy depends on how well you know where the drone was at the moment each photo was taken. There are three levels to that, and the difference is large.
Without correction the drone uses ordinary GPS, the same technology as your phone. Accurate enough to navigate, not to survey. With RTK, real-time kinematic, the drone receives correction data during the flight from a base station or a network service. That puts the camera positions within centimetres. Ground control points, GCPs, are marked points on the ground that you survey by a conventional method; the software ties the model to them, which also removes systematic tilt and distortion.
The values below are orders of magnitude that are common in practice. They depend on flight height, camera, overlap and the conditions during the flight, so read them as direction rather than specification.
| No RTK or GCP | With RTK | With RTK + GCP | |
|---|---|---|---|
| Relative accuracy | 1 to 2 cm | 1 to 2 cm | 1 to 2 cm |
| Absolute horizontal | roughly 1 to 2 m | roughly 2 to 5 cm | roughly 1 to 3 cm |
| Absolute vertical | roughly 2 to 6 m | roughly 3 to 8 cm | roughly 1 to 3 cm |
| Volumes and progress | Suitable | Suitable | Suitable |
| Setting out and machine control | Not suitable | Usually suitable | Suitable |
| Handover with datum levels | Not suitable | Depends on the requirement | Suitable |
There is an intermediate option that saves a lot of work in practice: a height calibration on a single known point. You survey one point whose level you know, for example a manhole cover or a previously surveyed benchmark, and set the model to it. That removes the vertical offset without having to lay out a full set of ground control points. For many handovers that is enough.
What does this mean for volumes?
With the two kinds of accuracy clear, you can see where the familiar 1 to 3% margin on a volume survey comes from. It is not determined by the absolute position of the model, but by three other things.
- Relative accuracy: how well the shape of the surface was captured
- The definition of the surface: whether loose debris, machines or vegetation were included or removed
- The reference surface: where you assume the foot of the pile sits, because you cannot see underneath it
That last point is often the largest source of error in practice, and it has nothing to do with the drone. If a pile sits on a flat concrete slab, the reference surface is unambiguous and the survey is sharp. If it sits in a hollow or against a batter, you have to assume how the ground runs underneath. A baseline survey of the empty ground, before the material arrives, solves that.
For a batch inspection, where the batch sits on a hard standing and its shape is fully visible, the volume calculation therefore lands consistently within about 2%.
When do you need which?
Summed up in a rule of thumb: for anything that is a proportion, RTK is enough. For anything that is a position, you want more.
- Stockpile volumes, progress, cut and fill, height differences and profiles: RTK is generally sufficient
- Levels tied to the national datum for a handover: a height calibration on a known point, or ground control points
- Machine control and setting out: ground control points, and even then alongside your RTK-GPS
- Cadastral boundaries and legal setting out: not drone work, but the work of a surveying firm
What photogrammetry cannot do
The method has a few hard limits, and they are worth knowing before you plan a flight.
- Water. A water surface reflects and moves, so there are no fixed points to match on. Puddles and ditches turn into noise in the model
- Dense vegetation. The camera sees the top of the crop, not the ground beneath it. For terrain levels under grass or scrub, photogrammetry is the wrong technique; lidar is for that
- Uniform or reflective surfaces. Fresh tarmac, clean concrete or a smooth sand bed have little recognisable structure, which makes matching points hard
- Moving objects. A lorry driving during the flight appears in different places in different photos and produces distortion. Stationary machines and containers do come out cleanly, but then they are inside your volume and have to be removed
- Overhangs. Photogrammetry from the air captures what is visible from above. A cantilever or a void under an overhang is not in there
For open sites with bulk material or earthworks these are rarely blocking limitations. For a site full of water and dense vegetation, it is worth knowing them up front.
What to look for when assessing an offer
Anyone buying a drone survey or considering a system can get a long way with a few questions:
- Is an accuracy quoted without saying whether it is relative or absolute? Then the figure cannot be judged
- Is the accuracy backed by a check survey on independently measured points, or is it a specification from a brochure?
- Which coordinate and height system is delivered, and has that been agreed beforehand?
- Is the survey repeated the same way? Only then can two surveys be compared, and that is the basis for progress and stock differences
How we do it
Everything above is exactly why we built AiroMap as one whole rather than as separate parts. Flight height, overlap and flight pattern are computed automatically from the area you mark out, so the settings that determine quality are not something you have to get right yourself.
Depending on the application the drone flies with RTK, which is sufficient for most day-to-day survey work. For projects where absolute level counts there is a heavily automated ground control point workflow, and a height calibration on a single known point for the cases in between. Processing happens in the cloud, so there is no photogrammetry software on your laptop and no specialist needed to compute a model.
That is the heart of how we see it: photogrammetry is a discipline, but surveying a stockpile or a site does not have to be. The technique from this article sits under the bonnet, so your own people can survey after half a day of training and trust the result.
See the AiroMap platformHow this works for stock and volume surveysHow this works for earthworks and civils