How AVG surveys six sites across two countries four times a year
Six yards in the Netherlands and Germany, one employee, one day per quarter. How AVG surveys its entire stock, and why comparability matters more there than any single measurement.

Once a quarter, one AVG employee gets in the car with a drone in the boot. In a single day he covers all six sites: three in the Netherlands, three in Germany. By the end of that day the entire company's stock has been surveyed.
That, in one sentence, is why we are sharing this. Not because a drone survey is remarkable, but because at this scale it turns out to work just as simply as it does on one yard.
Six yards, two countries
AVG is one of the larger recycling and raw-materials companies in its region and operates from sites on both sides of the border: Heijen, Velddriel and Hoogveld in the Netherlands, and Goch, Rheinberg and Duisburg in Germany. The yards run from roughly 2 to 7 hectares.
What is on them varies a great deal per site. From timber waste and concrete rubble to crushed and milled concrete granulate and clean streams such as white sand. For a survey that matters: those materials differ in colour, texture and how they pile up, and it is precisely those differences that defeat an estimate by eye.
Why six sites are a different problem from one
On one yard an inaccurate stock estimate is an inconvenience. Across six yards it becomes something else, for two reasons.
First, the uncertainties add up. Six estimates each a few percent out produce a consolidated figure nobody can vouch for. Second, and in practice this weighs more heavily: without one fixed method the sites cannot be compared with each other. If every site estimates in its own way, you cannot tell whether a difference between two yards is real or just a difference in who did the estimating.
That is the heart of why AVG runs this centrally. One method, across all six sites, at the same point in the quarter.
One day a quarter, one employee
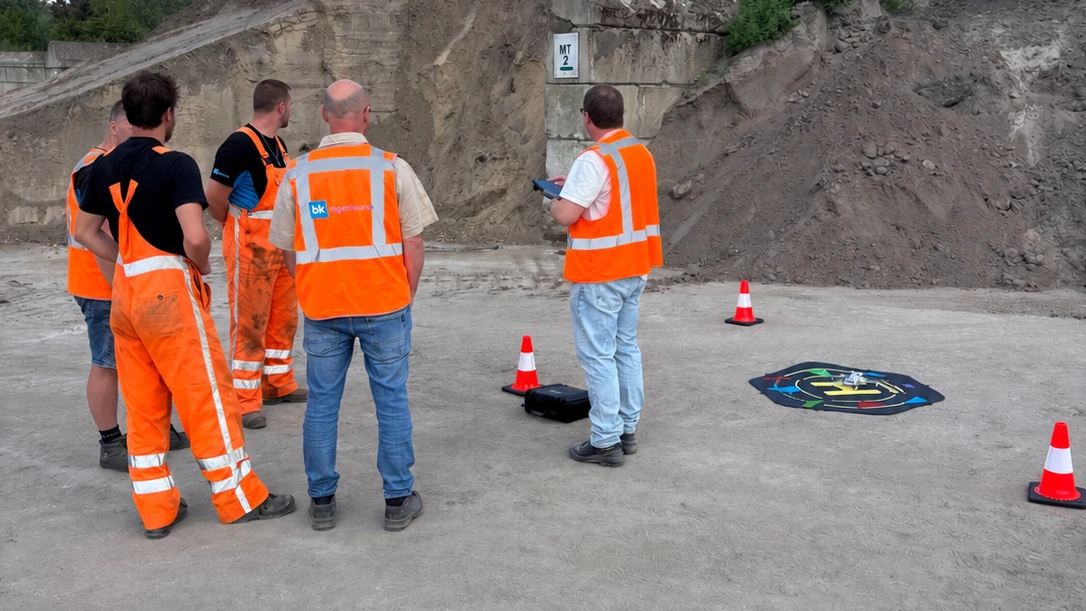
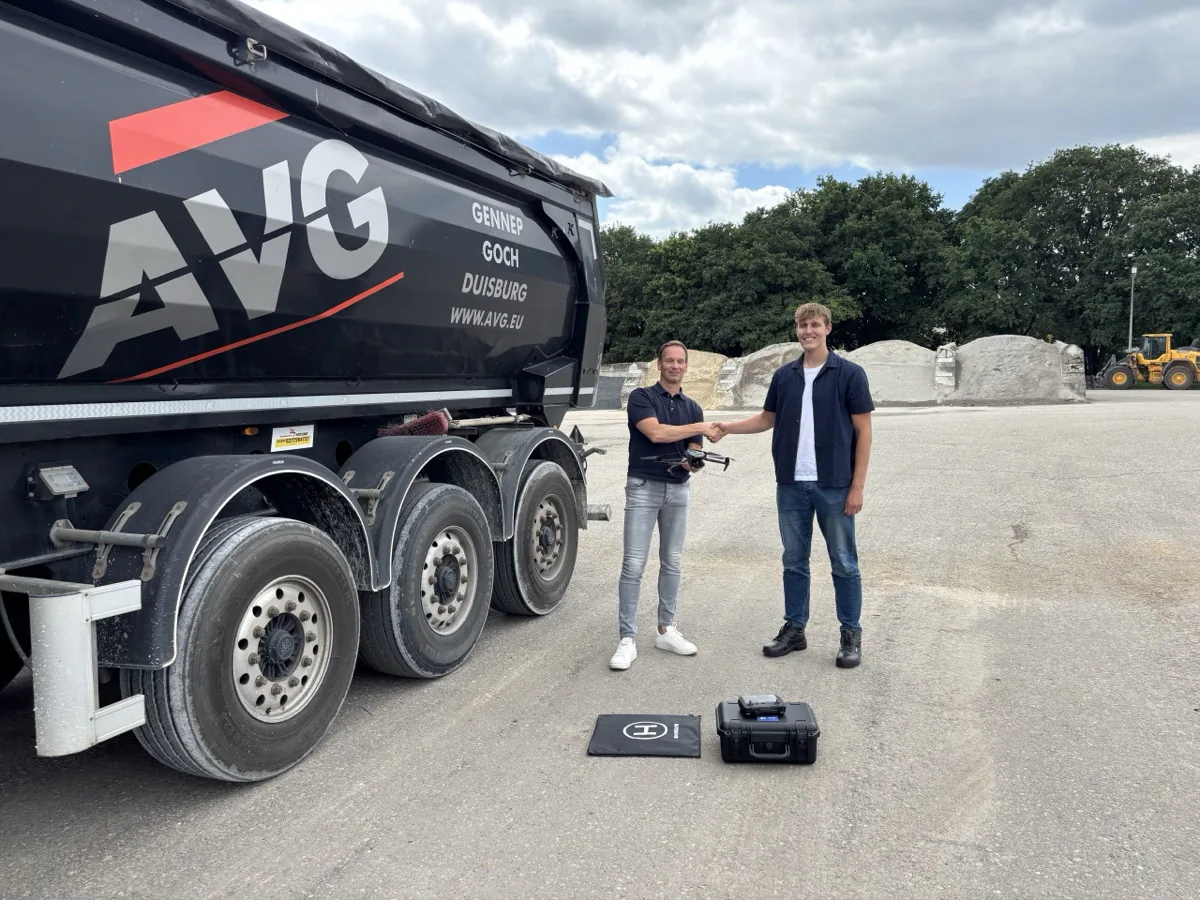
The survey is carried out by one of their own people. He took our half-day training and obtained the required drone certificate, which leaves him qualified and working independently. No external firm turns up and no survey company has to be booked in.
Per site the work is limited: put the drone down, mark the area, start. The drone flies the route itself and lands again. Then on to the next site. The images go to the cloud, where they are processed automatically into 3D models with a calculated volume per stockpile.
The fact that the sites sit in two countries makes no technical difference. It is the same method, the same software and the same report format on both sides of the border, and the figures come together in one place.
What happens with the figures
The quarterly report goes to the finance function, which sets the surveyed stock alongside the stock records. That is a comparison which was not really possible before the surveys: there was no independent figure to hold it up against.
That comparison produces insight that sits in almost no stock administration anywhere. Internal material flows, meaning moving, screening and crushing on your own site, never cross the weighbridge and are therefore recorded nowhere. That is not a quirk of AVG but a blind spot built into how the whole sector works. The difference is that AVG now looks at it, and uses what it finds to tighten those processes further.
The point behind this example
The gain was not only a more accurate stock figure, but what that figure exposed. A survey you can compare against your own records tells you something about your processes, not just about your stock.
Comparability is the real advantage
One accurate survey tells you what is there now. At this scale the value comes from repetition: because every survey is produced the same way, the figures per site can be compared across quarters, and the sites against each other.
That shifts the conversation from "how much is there?" to "what has changed, and where?". For an organisation with six sites that is a materially different question, and a more useful one.
A real step towards stock management we can rely on.
When this applies to you too
What this example mainly shows is that scale is not an obstacle. A few characteristics make the comparison with your own situation easy:
- Multiple sites, where a consolidated stock figure is currently assembled from separate estimates
- Yards of several hectares, too large to measure seriously with a tape
- A broad material range, from contaminated streams to clean raw materials
- Internal processing that does not cross the weighbridge and so is recorded nowhere
- A finance function that wants to be able to substantiate the stock valuation
If three or more of those apply, the gap between your records and reality is probably wider than you would like.
How this is set up
AVG uses AiroMap: one package with drone, software, training and support. That the survey sits with one of their own people rather than an external firm is what makes the quarterly cycle workable, because hiring in six sites is a scheduling exercise; doing six sites yourself is a day.
Want to know how this works out for your sites? We come over, survey a yard and deliver a sample report with your actual volumes, so you can see the difference against your current figure for yourself.
See how stock surveys work with AiroMapHow a drone volume survey works, step by step